What's the Real Solar Payback Period? (And Why Most Estimates Are Wrong)
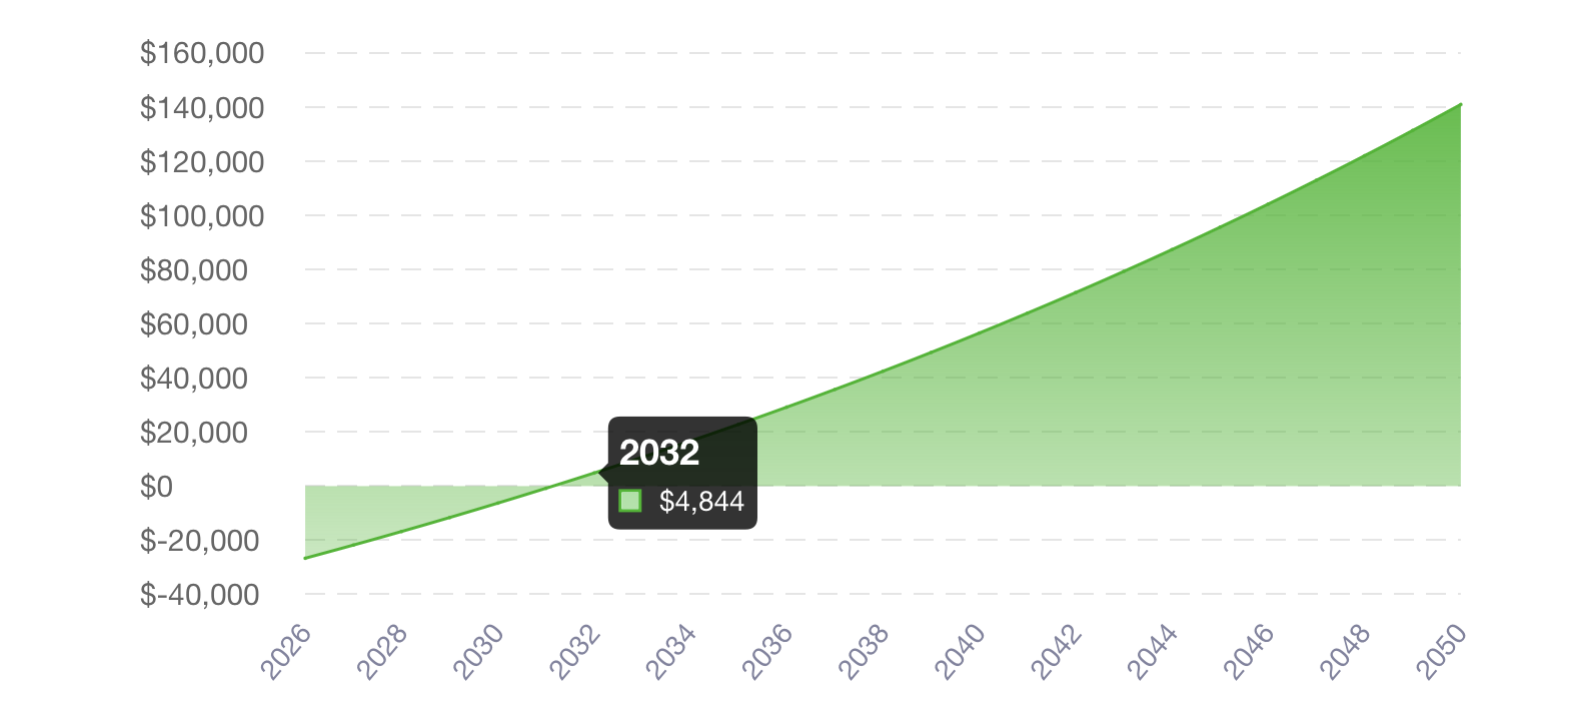
- Standard solar payback calculations are often incomplete, failing to account for key variables like future electricity rate increases, panel degradation, and real-world shading losses.
- Real solar payback for Massachusetts homeowners is significantly impacted by future electricity rates (projected 3-5% annual escalation), panel degradation (0.5% per year industry average), and accurate shading analyses (potentially reducing production by 10-25%).
- System oversizing and generic proposals without addressing self-consumption ratios or specific coverage targets can inflate costs and project optimistic savings, masking a longer actual payback period.
Most online solar payback calculators will tell you your system breaks even in 6 to 8 years. Some will say 4. A few will say 10. They're all using the same formula and almost none of them are accounting for the variables that actually move the number.
By the end of this, you'll know what drives the real payback period for Massachusetts homeowners in 2026, which inputs most estimates get wrong, and how to read your own proposal with a sharper eye.
If you already have a proposal and want to know if the numbers hold up — or if you want one built correctly from the start — you can get your design and see real installer pricing at Terawatt. The system design is engineered from your actual address, with a real shading analysis, before any installer quotes against it. No sales calls until you decide to move forward. Otherwise, read on — the variables below are worth understanding before you sign anything.
The Standard Formula — And Why It Falls Short
The calculation most tools use is simple:
Net system cost ÷ Annual savings = Payback period
On paper: a $28,000 system, after a state tax credit of $1,000, nets out at $27,000. At $2,000 per year in electricity savings, that's a 13.5‑year payback.
That formula isn't wrong. It's just incomplete.
It treats electricity savings as a flat, fixed number. It assumes your panels produce exactly what they're designed to produce. It ignores what happens to your utility rate in year 5, year 10, or year 15. And it doesn't account for the gap between how much energy your system generates and how much of it you actually use at home versus export to the grid.
Each of those gaps shifts the real breakeven date by 1 to 3 years — in either direction.
The 5 Variables That Actually Determine Your Payback
1. Your Electricity Rate — Today and Tomorrow
This is the biggest variable in the entire equation, and most calculators plug in your current rate and leave it there.
Massachusetts homeowners pay among the highest electricity rates in the country — $0.24 to $0.36 per kWh depending on your utility and rate schedule. Compare that to the national average of around $0.18/kWh, and you start to see why payback periods in Massachusetts are shorter than most national estimates suggest.
But the more important number is your future rate.
Eversource and National Grid have both posted multiple rate increases in recent years. The EIA projects national electricity rates to rise another 13–18% by the end of 2026, and Massachusetts has historically tracked at or above the national average on rate growth. If you model savings at your current rate and never adjust, you're significantly underestimating the long‑term value of your system.
A more accurate calculation applies 3–5% annual rate escalation to your savings. On a 25‑year system life, that difference alone can shorten your modeled payback by 1 to 2 years compared to a flat‑rate calculation.
What to check in your proposal: Ask whether the installer's savings projection uses a flat electricity rate or assumes any annual rate increase. Most default to flat. Ask them to run the numbers at 3% annual escalation and see what changes.
2. Panel Degradation
Solar panels don't produce the same amount of energy in year 25 that they produce in year 1. The industry standard degradation rate is about 0.5% per year — meaning by year 10, your panels are producing roughly 95% of their original output. By year 25, around 88%.
That matters for payback math.
An estimate built on year‑1 production numbers, projected flat for 25 years, overstates total energy output by 6–8% over the system's lifetime. For a well‑sized Massachusetts system producing around 12,000 kWh per year, that adds up to thousands of kWh of overestimated production — and meaningfully inflated savings projections.
Premium panels (REC Alpha, Panasonic Evervolt) carry degradation guarantees of 0.25–0.30% per year — about half the industry standard. That difference is worth factoring in when you're comparing equipment tiers, especially if you're planning a 20+ year hold.
3. Shading Losses
A solar proposal that shows your annual production without a shading analysis is guessing.
Mature trees, neighboring rooflines, chimneys, and dormers all reduce actual production — often by 10–25% on partially shaded roofs. Installers who run a proper shading analysis (using tools like Aurora Solar or Solargraf) will show you a specific production estimate for your actual roof. Installers who don't are using regional solar irradiance averages with zero adjustment for what's on and around your roof.
The difference can be substantial. A system that a generic calculator estimates will produce 14,000 kWh per year might only produce 11,500 kWh with actual shading factored in. That's nearly 20% less — and a payback period that stretches significantly if you're not looking at the real numbers.
Red flag: If your proposal lists production as a round number (12,000 kWh, 14,000 kWh) with no address‑specific shading details, ask how that number was derived. If it came from a zip code average, it's not your number.
4. Self‑Consumption Ratio
Not all of your solar production is worth the same amount.
The electricity your panels produce while you're home and using it offsets power you'd otherwise buy at retail rates — in Massachusetts, that's $0.24 to $0.36/kWh. Energy you export to the grid when no one's home gets credited at net metering rates, which in Massachusetts currently mirrors the retail rate. But that's not guaranteed to stay true.
Most payback calculators assume 100% of production offsets retail electricity costs. In reality, the average homeowner self‑consumes roughly 70–80% of what their panels generate. The rest is exported.
Right now in Massachusetts, 1:1 net metering means the value difference is minimal. But Massachusetts utility policy on net metering has shifted before, and proposals that don't distinguish between self‑consumed energy and exported energy are building assumptions that could prove optimistic over a 25‑year system life.
If you're home during the day, or if you work remotely, your self‑consumption ratio is likely higher — and your effective savings per kWh are better than the average estimate. If you're out of the house 9 to 5, you may want to look at battery storage to capture more of that midday production at the higher retail rate.
5. System Sizing and the "Bigger Is Better" Trap
A common installer move is to propose a system that's larger than you need.
Larger systems mean larger contracts, more revenue, and a pitch that sounds more impressive. But in Massachusetts, where the SMART 3.0 Program (effective 2026) pays a fixed per‑kWh rate for 20 years, an oversized system that produces more than you consume still generates SMART credits. The economics can work — but only if the system is sized correctly against your actual usage.
The problem: a system sized to 120% of your historical usage, with a higher sticker price, will show a longer payback period than a right‑sized system at 100% coverage. Proposals with inflated system sizes inflate both cost and production — but the cost is real and the savings projection often isn't, because you can only offset so much of your bill before the value of each additional kWh falls.
What to ask: Request that your proposal show the coverage ratio — what percentage of your annual electricity usage the system covers. For most Massachusetts homeowners, 90–100% coverage is the sweet spot. Above that, you're paying for capacity that adds marginal value.
One exception worth knowing: if you're adding a battery alongside your panels, slightly oversizing the solar array can make sense. Massachusetts' ConnectedSolutions program pays homeowners to discharge their battery during peak grid demand events — typically netting $200–$500 per year in additional income. That extra production feeds the battery, which in turn participates in the program. For some homeowners, this combination shortens payback by an additional 1–2 years and is one of the more compelling financial cases for pairing storage with solar now that the federal ITC is gone.
What the Real Numbers Look Like in Massachusetts (2026)
With these variables properly modeled, here's what payback actually looks like for a typical Massachusetts homeowner in 2026:
Scenario | System Cost | Net Cost (after $1k state credit) | Annual Benefit (electricity savings + SMART income) | Est. Payback |
|---|---|---|---|---|
Eversource, $0.26/kWh, good roof | $28,000 | $27,000 | $2,500–$3,100 | 8–9 years |
National Grid, $0.29/kWh, south‑facing | $30,000 | $29,000 | $2,900–$3,400 | 8–10 years |
Cape Light Compact, $0.24/kWh, some shading | $26,000 | $25,000 | $2,000–$2,500 | 10–12 years |
Net Cost reflects the actual out‑of‑pocket cost after the MA state tax credit — the number you'd need to finance or pay cash. SMART 3.0 payments (~$0.03–$0.04/kWh for 20 years) are performance‑based income paid over time, not upfront, so they belong in the annual benefit column, not the sticker price. Estimates assume 3% annual rate escalation and 0.5% panel degradation. No federal ITC — that credit expired January 1, 2026 for homeowner‑purchased systems. For background, see Solar Incentives Still Available in 2026.
The national average is often cited at 9–12 years post‑ITC. Massachusetts, with its high utility rates and SMART program, consistently comes in below that national range — typically 6–9 years when properly modeled.
How to Pressure‑Test Any Payback Estimate
When you get a solar proposal, ask these four questions:
1. What electricity rate did you use, and is it escalating?
If they used a flat rate, ask them to rerun savings projections at 3% annual growth. The payback period should shorten.
2. Did you run a shading analysis on my specific roof?
A credible proposal will have a production simulation tied to your address — not a regional average.
3. What's the panel degradation rate, and is it in the production model?
Ask to see year‑10 and year‑20 production estimates. If those numbers are the same as year‑1, it's a flat model.
4. What's the system's coverage ratio?
Your proposal should show what percentage of your annual usage the system offsets. Right‑sizing matters more than having the biggest system on the block.
The Bottom Line
The payback period number in your proposal is only as reliable as the assumptions behind it. Most calculators — and more than a few installer proposals — undercount rate escalation, skip the shading analysis, ignore degradation, and size systems to maximize the sale rather than the return.
In Massachusetts, a well‑modeled system at today's rates and current incentives typically pays back in 6 to 9 years. A poorly modeled one will tell you the same number and deliver a different result.
The fix isn't a better calculator. It's a better proposal.
How Terawatt Approaches This Differently
Every problem covered in this post — inaccurate shading assumptions, flat‑rate savings projections, oversized systems, proposals you can't compare — comes back to the same root issue: most homeowners get one proposal, built on assumptions they can't see, from a company whose incentive is to close the deal, not optimize the return.
Terawatt flips that.
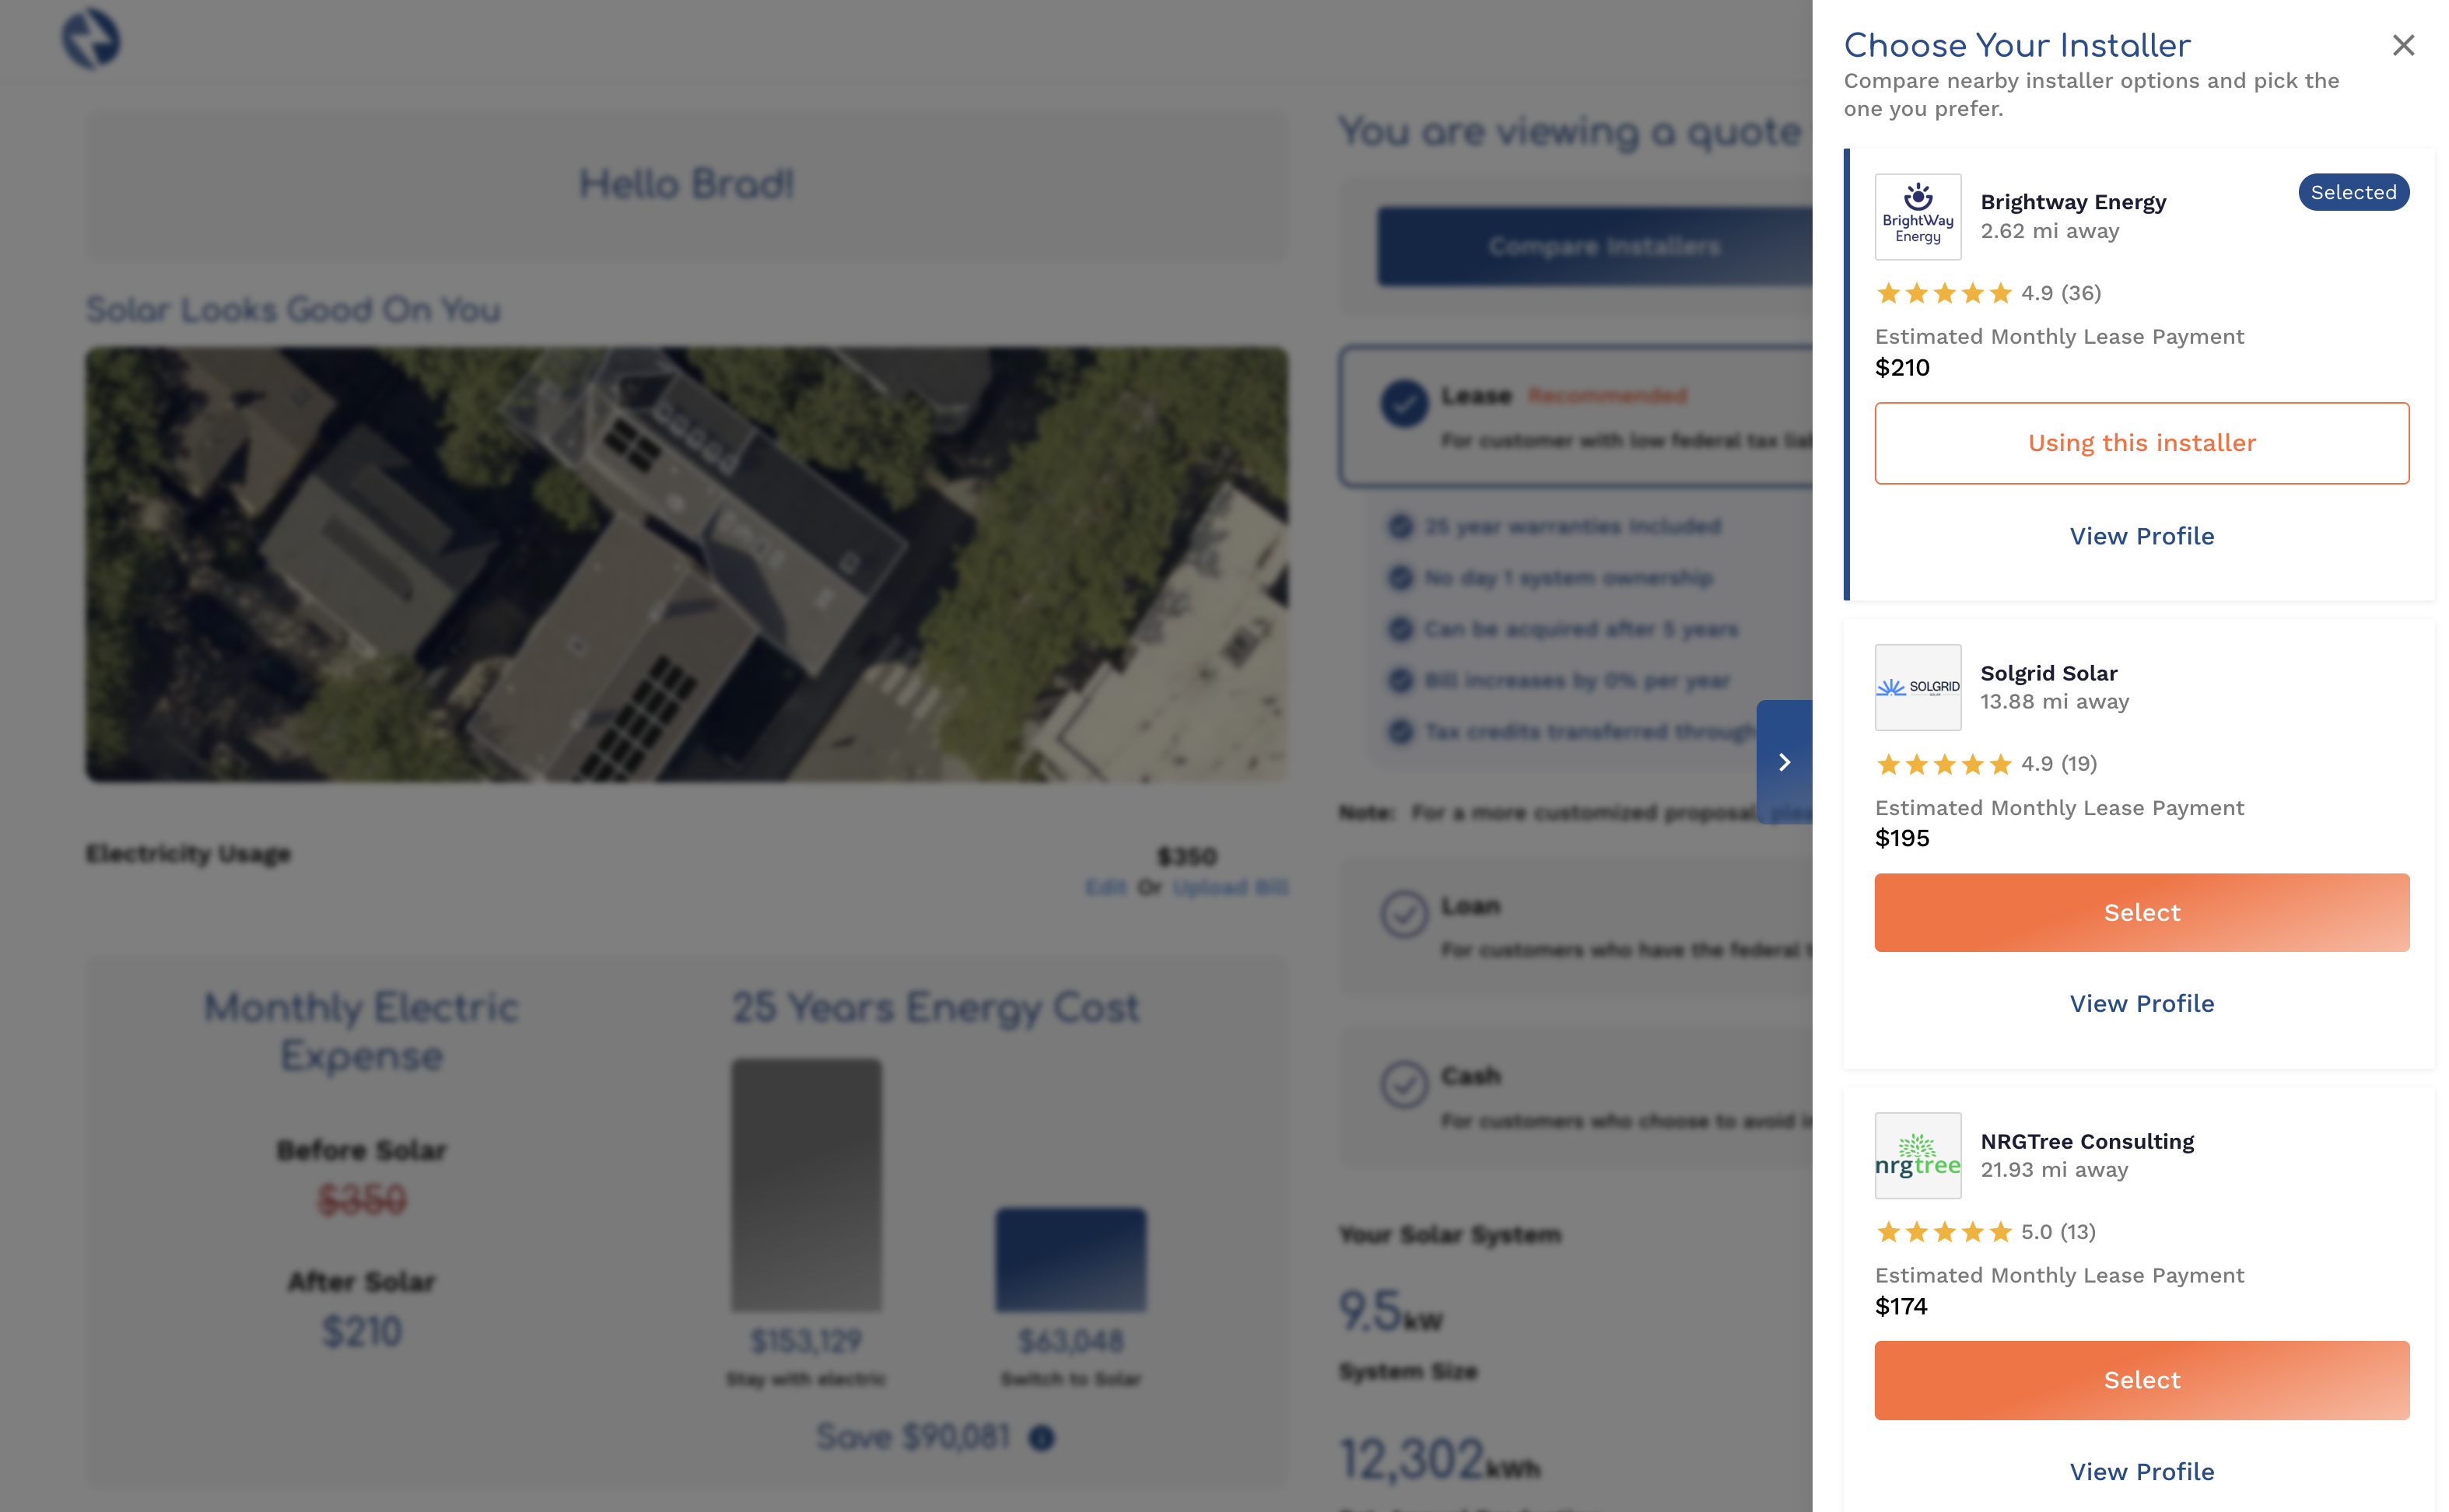
Enter your address and Terawatt builds a fully engineered system design tied to your specific roof — real satellite shading data, right‑sized to your actual utility usage, with production estimates modeled for your location. That design is then priced by multiple verified local installers. You see what each installer charges for the same system — same panel count, same equipment specs, same production estimate — ranked side by side by price and reviews.
That means the shading analysis is already done. The system coverage ratio is already calculated. You're not comparing a $28,000 proposal from one company against a different $22,000 proposal for a smaller system from another — you're comparing real prices for the same job.
What you won't get: a sales call before you ask for one. Your contact information stays private until you decide to move forward. No pressure. No commission‑based rep managing your timeline.
When you're ready to pressure‑test the numbers, Terawatt AI is available to walk through rate assumptions, SMART program details, payback scenarios, or anything else — at any hour.
The process takes about 60 seconds to start:
Enter your address
Get a fully engineered system design built for your roof
See pricing from multiple verified installers on the same design
Compare, ask questions, move forward on your timeline
Already have a proposal you want to sanity‑check? Bring it to Terawatt. Enter your address and see how your current quote compares to what verified local installers would charge for the same system.
Sources: EnergySage Massachusetts Solar Data (2026), My Generation Energy Payback Analysis (2026), EIA Electricity Price Projections (2026), NEDES Solar Payback Guide (2026), Clean Energy Calculator — Solar Degradation (2026), BostonSolar Simple Payback Formula Guide, Greenlancer Solar Payback Period (2026)